-1.png?width=122&height=75&name=AG%20Logo%20ReImagined%20-%20Gold%20Text%20(Main)-1.png)


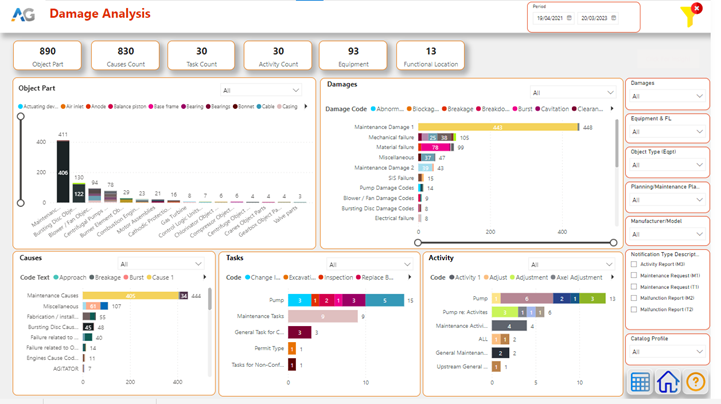
In Asset Maintenance, businesses often require significant statistical maintenance data and the history of a technical object to analyse its performance, efficiency and involvement in production. With this analytical data, the Maintenance professionals can take appropriate action to improve technical object's performance. This data can be captured with the SAP business transaction - the Notification (Maintenance request or Malfunction report). With the Notification, the user can record the Failure modes and their effects, break down durations and maintain Catalogs in the form of predefined code groups and codes. The objective of using codes is to standardise the data across industries. For example, ISO14224 defined reliability and maintenance for Equipment for Oil & Gas industries. Standard SAP allows the user to capture the data related to Object part, Damage, Cause, Task, Activity and Failure mode in the form of codes.
AG uses the analytical data acquired from Maintenance notification history and develops user-responsive Dynamic Graphical report - Analytical reports from Maintenance notification history for practical analysis, using Power BI, an interactive data visualisation software developed by Microsoft. Further, the Analytical reports from Maintenance notification history are analysed based on the following Key Performance Indicators (KPI).
- Object Damage Analysis
- Breakdown Analysis
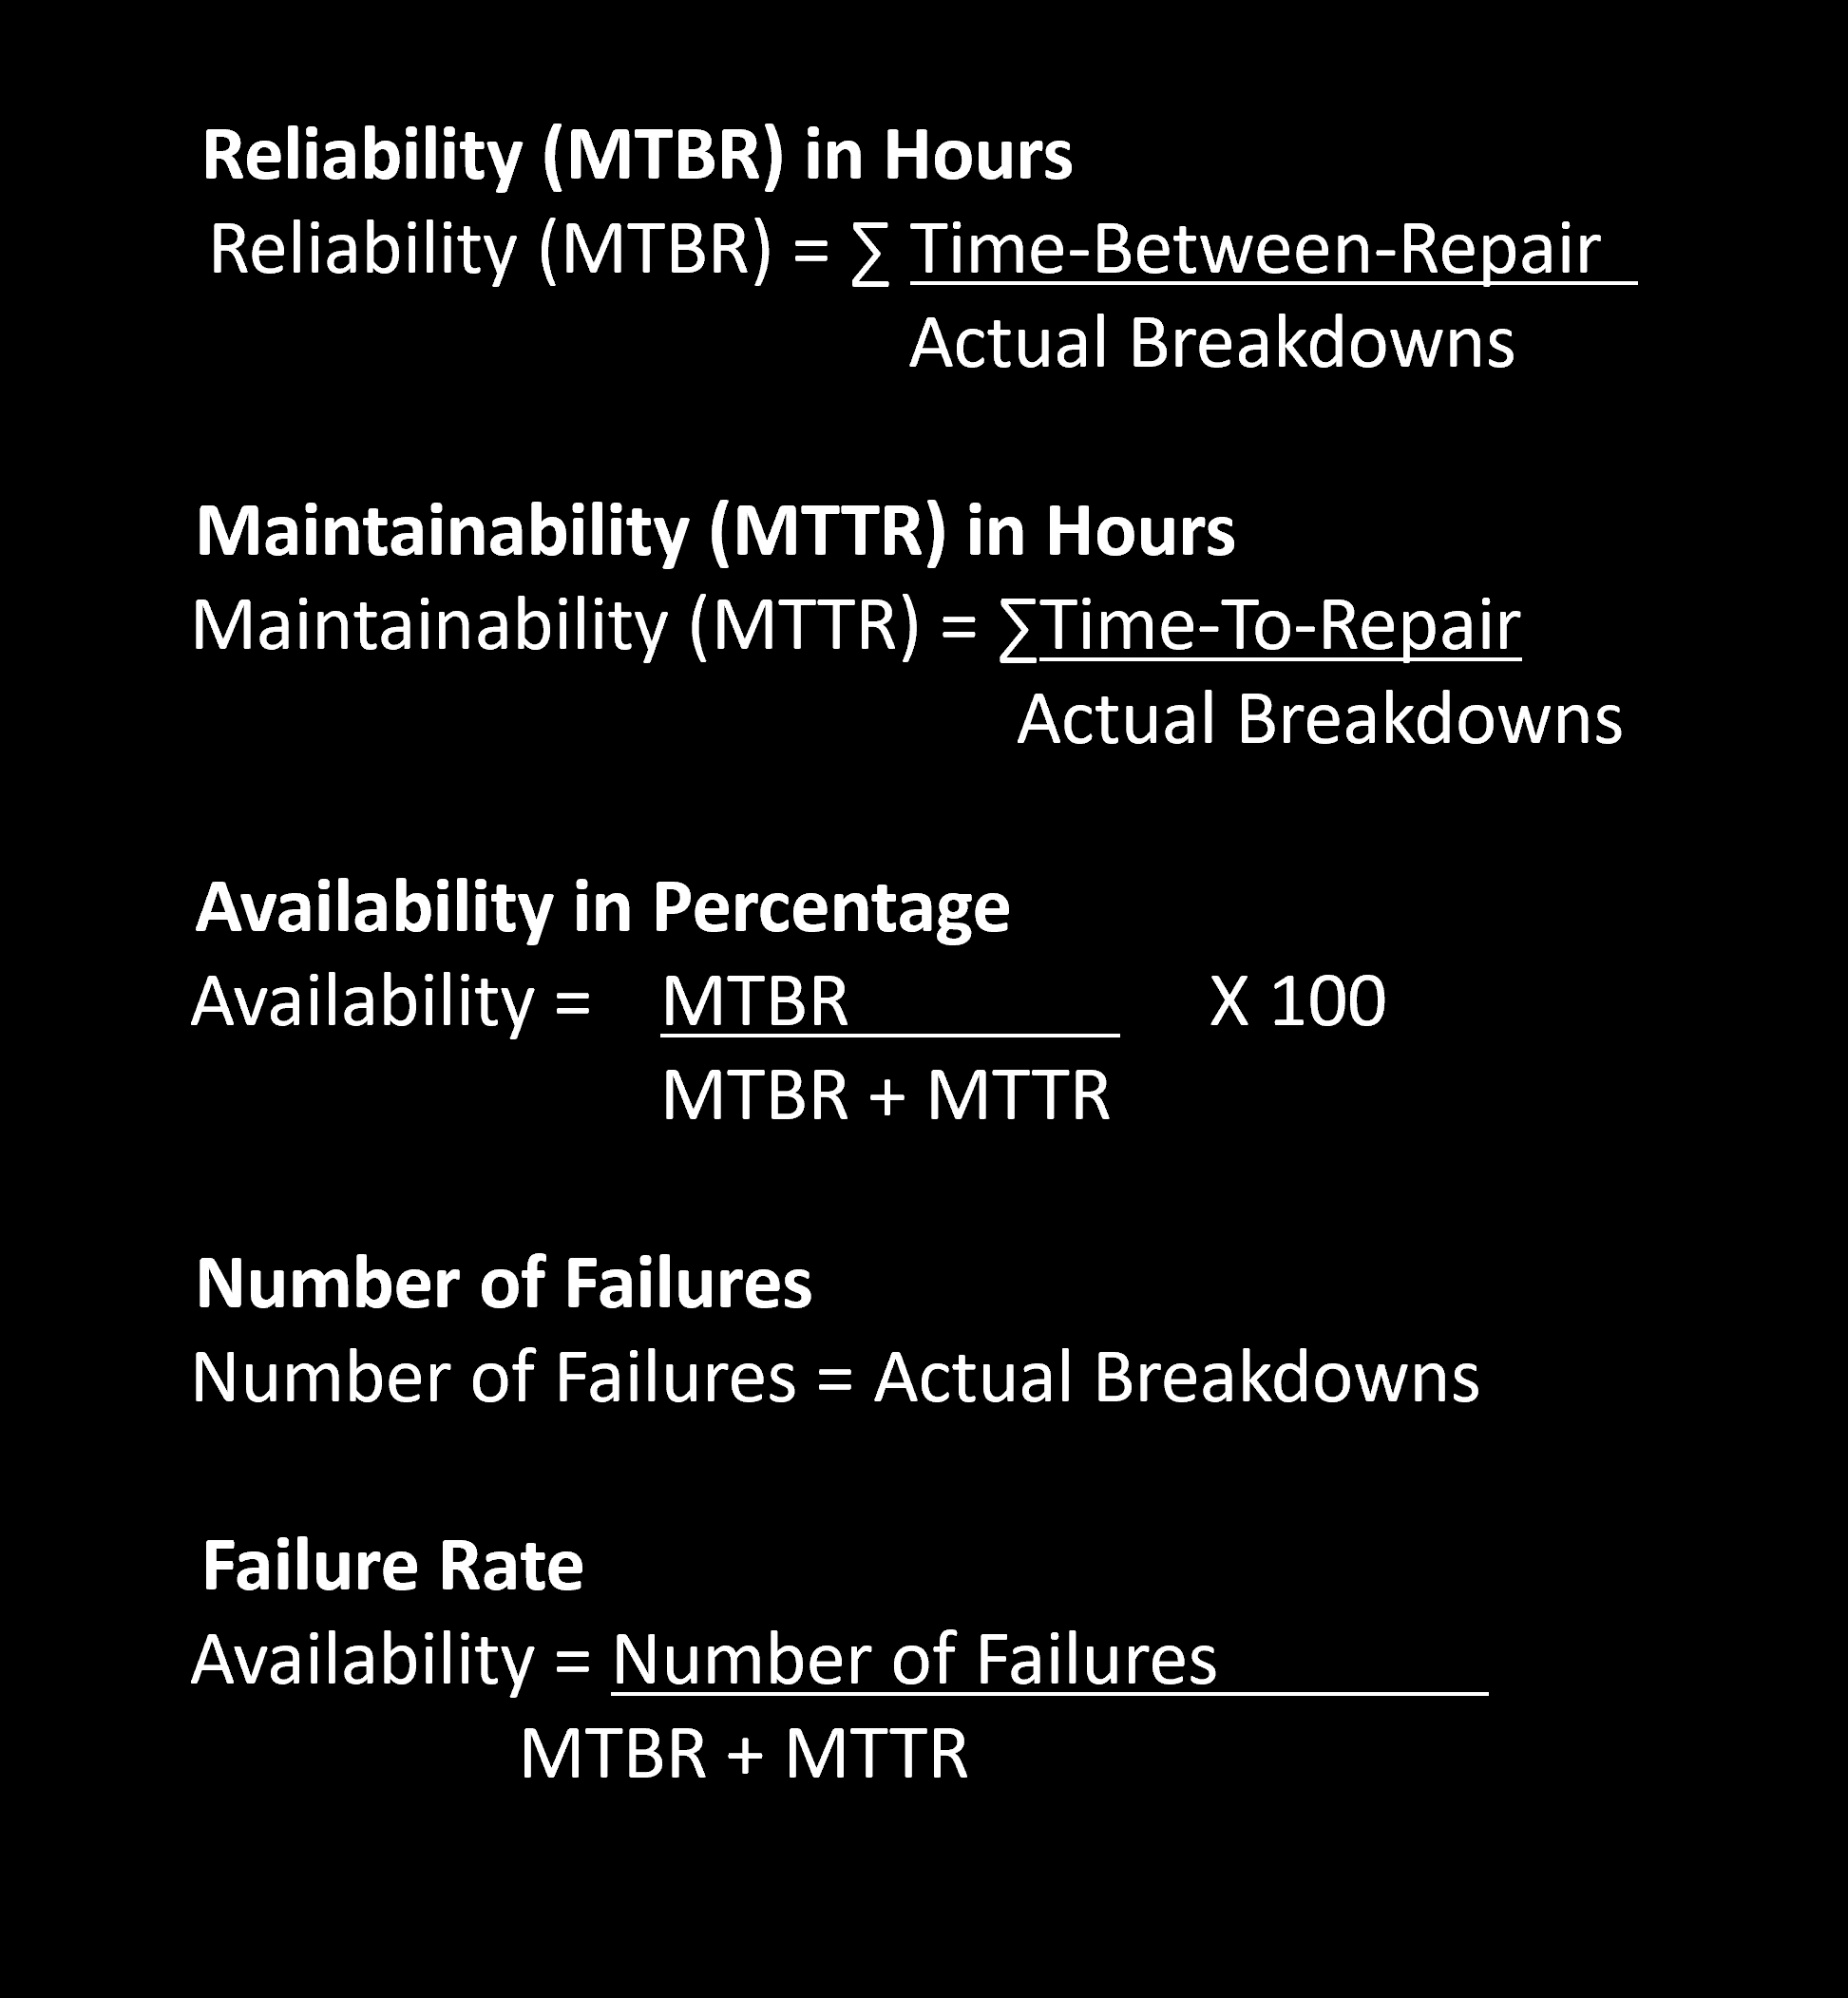
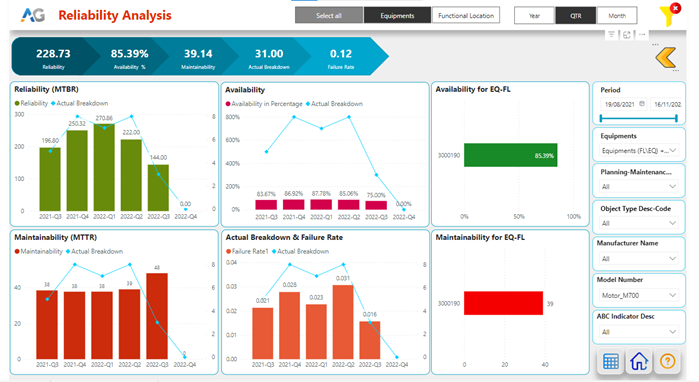
- Reliability, Availability & Maintainability (RAM) Analysis
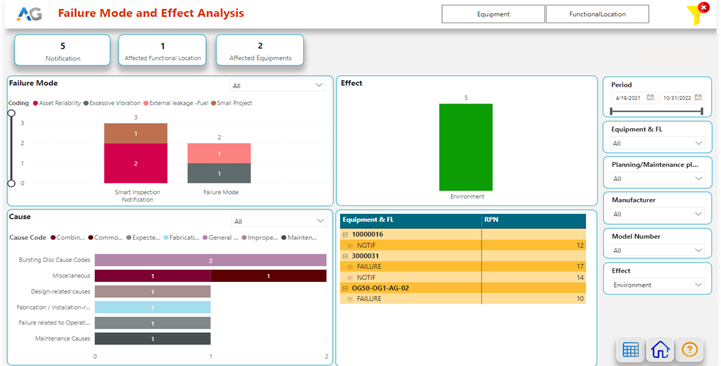
- Failure Mode and Effect Analysis (FMEA)
- Severity = Effect (Rank -S) count for the period
- Occurrence = Cause code count for the period (Rank- O)
- Detection = Number of Preventive & Corrective/predictive Maintenance orders/Notifications completed for the period. (Rank -D)
Reducing the asset maintenance cost and increasing asset availability is mandatory for any organisation to remain competitive globally. To achieve this, follow the right strategy for maintenance of the asset and its renewal/replacement to optimise the overall life cycle cost of the asset. The only way to do this is to get the correct data, make the right decision, and get the right resources at the right time.